
In this concluding section, we will explore tools (and few techniques) that have been specifically designed to improve the detection of memory errors in development or testing settings. While these tools often incur a significant performance overhead, they are not commonly utilized in production environments. However, they possess the full capacity to prevent memory corruption, similar to the techniques we have previously discussed in the first and second generation mitigations.
BoundsChecker
Around 1991 NuMega corp released a Memory leaks detection suite that is capable of detecting many kinds of array and buffer overrun conditions. Currently the tool is supported as part of Visual Studio in the form of Devpartner studio.
DevPartner suite has Error Detection functionality helps you find memory corruption problems caused by one of the following types of problems:
- Overrun allocated buffers (Buffer overflow)
- Continued access to memory after it has been deallocated (Use after free)
- Deallocating a resource multiple times (Double free)
The works by conducting instrumentation to effectively track memory usage and validate API calls. Unfortunately, the source code for this suite is not accessible, and due to its limited popularity, I made the decision to refrain from further exploration.
Limitations of BoundChecker
Due to the proprietary nature of Boundschecker, it has not been implemented anywhere and has not gained much popularity.
Because of its extensive instrumentation and runtime memory tracking, it is not utilized in production but rather serves as a testing suite during application development phases.
Furthermore, the tool has not been maintained for several years.
PageHeap
Sometime around 199X, Windows has added a feature of pageheap in WDK suite to monitor heap allocation and detect any access overruns in heap. PageHeap was present in GFlags, the Global Flags Editor, that is use to enable and disable advanced debugging, diagnostic, and troubleshooting features.
PageHeap has a very straightforward implementation. When a process is started with GFlag, each heap allocationcan be either writes fill patterns at the end of each heap allocation and examines the patterns when the allocations are freed, or it places an inaccessible page at the end of each allocation so that the program stops immediately if it accesses memory beyond the allocation.
Using PageHeap:
- To enable standard page heap verification for all processes, use
gflags /r +hpaorgflags /k +hpa. - To enable standard page heap verification for one process, use
gflags /p /enable ImageFileName. - To enable full page heap verification for one process, use
gflags /i ImageFileName +hpaorgflags /p /enable ImageFileName /full.
TODO: Add PageHeap in action section
Memcheck (Valgrind)
Memcheck is a module in Valgrind project added in 2003. The whole Valgrind project uses dynamic memory instrumentation to work, so does memcheck.By employing memcheck, all memory reads and writes undergo thorough examination, and calls to malloc/new/free/delete are closely monitored. Consequently, Memcheck has the capability to identify various issues:
- Use of uninitialised memory
- Reading/writing memory after it has been free'd
- Reading/writing off the end of malloc'd blocks
- Reading/writing inappropriate areas on the stack
- Memory leaks - where pointers to malloc'd blocks are lost forever
- Mismatched use of malloc/new/new [] vs free/delete/delete []
- Overlapping src and dst pointers in memcpy() and related functions
Technical details
Memcheck performs four kinds of memory error checking.
- First, it tracks the addressability of every byte of memory, updating the information as memory is allocated and freed. With this information, it can detect all accesses to unaddressable memory.
- Second, it tracks all heap blocks allocated with malloc(), new and new[]. With this information it can detect bad or repeated frees of heap blocks, and can detect memory leaks at program termination.
- Third, it checks that memory blocks supplied as arguments to functions like strcpy() and memcpy() do not overlap. This does not require any additional state to be tracked.
- Fourth, it performs definedness checking: it tracks the definedness of every bit of data in registers and memory. With this information it can detect undefined value errors with bit precision.
Memcheck uses something called shadow memory to keep track of addressability of process original memory. The Valgrind framework intercepts function and system calls which cause usable address ranges to appear/disappear. Memcheck is notified of such events and marks shadow memory appropriately. For example, malloc and mmap bring new addresses into play: mmap makes memory addressable and defined, whilst malloc makes memory addressable but undefined. Similarly, whenever the stack grows, the newly exposed area is marked as addressable but undefined. Whenever memory is deallocated, the deallocated area also has its values all marked as undefined. Memcheck also uses such events to update its maps of which address ranges are legitimately addressable. By doing that it can detect accesses to invalid addresses, and so report to the user problems such as buffer overruns, use of freed memory, and accesses below the stack pointer.
Moreover, It normally uses 2 bits of shadow memory(explained in detail in next section) per byte of application memory; the shadow for every byte has 4 states: addressable and initialized, not addressable, address-able but uninitialized, addressable and partially initialized. If the byte is partially initialized then the tool maintains a second layer of shadow, this time with bit-to-bit mapping.
The most complex part of Memcheck working is the definedness feature. The basic idea underlying the definedness checking is as follows.
• Every single bit of data, b, maintained by a program, in both registers and memory, is shadowed
The first three checks are done using instrumentation by a piece of metadata, called a definedness bit. For historical reasons these are often also referred to as V bits (V being short for “validity”). Each V bit indicates whether or not the bit shadows is regarded as currently having a properly defined value.
Every single operation that creates a value is shadowed by a shadow operation that computes the V bits of any outputs, based on the V bits of all inputs and the operation. The exact operations performed by this shadow computation are important, as they must be sufficiently fast to be practical, and sufficiently accurate to not cause many false positives.
• Every operation that uses a value in such a way that it could affect the observable behavior of a program is checked. If the V bits indicate that any of the operation’s inputs are undefined, an error message is issued. The V bits are used to detect if any of the following depend on undefined values: control flow transfers, conditional moves, addresses used in memory accesses, and data passed to system calls.
A V bit of zero indicates that the corresponding data bit has a properly defined value, and a V bit of one indicates that it does not. Every 32-bit general purpose register is shadowed by a 32-bit shadow register, and every byte of memory has a shadow V byte.
Memcheck in action
Let’s run the classic_overflow program under with valgrind:
Output:
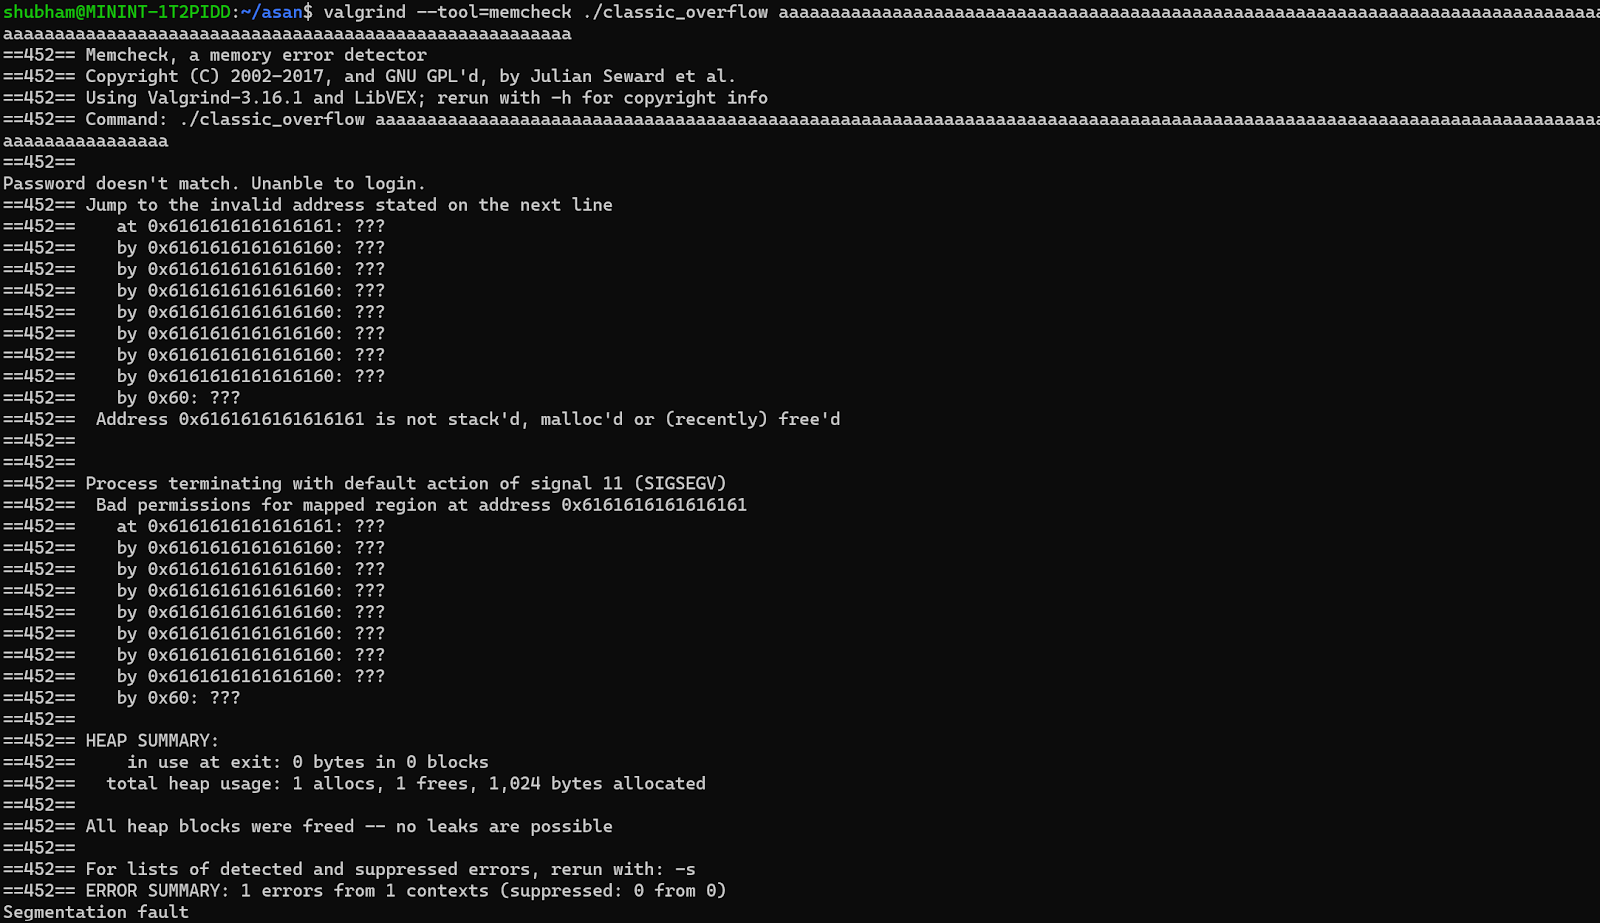
In the output, you will observe that memcheck is able to detect an overflow scenario and display the stack data for the purpose of debugging.
Limitations of MemCheck
Due to the definedness feature and extensive instrumentation, running the program with memcheck can result in a slowdown of up to 40%. Additionally, the memory usage is doubled due to the inclusion of shadow bytes. As a result, memcheck is typically only used in a testing environment to identify bugs in the application. These tools are commonly employed to either track down specific bugs or confirm the absence of any hidden bugs (which can be detected by Memcheck) in the code.
In addition to the performance penalty, an important limitation of Memcheck is its inability to detect all cases of bounds errors in the use of static or stack-allocated data. The following code will pass the Memcheck tool in Valgrind without incident, despite containing the errors described in the comments:
Resources:
https://nnethercote.github.io/pubs/memcheck2005.pdf
Taint trace
Developed in 2006 by researcher from MIT, Tainttrace was a tracing tool that protects systems from software exploits. The tool is capable of protecting against following types of memory corruptions:
- Buffer overflows
- Format string attacks
- Indirect branch modifications
Tainttrace worked dynamically hence doesn’t need any specific compilation. It uses DynamoRio for dynamic instrumentation. Besides that, it uses 1to1 shadow memory mapping for application memory to keep track of memory structure of process. More information below from there research paper:
The system consists of four components. A configuration file is used to specify the security policy. The shadow memory is a data structure used to maintain the taint information of application data. Program monitor is the core module used to perform the instrumentation, intercept system calls, and enforce security policies. A customized loader is used to load the application binary, shadow memory, and program monitor into different memory spaces. To start an application, our loader first loads the various components into specific memory spaces and then passes control to the program monitor. The program monitor reads the configuration file and sets up the tracing policy. It also initializes the shadow memory, that is, it marks the untrusted sources specified by the configuration file as tainted, and other sources as clear. After initialization, the application executes under our program monitor. All the code to be executed in user mode is first copied into the code cache. This includes application code and shared libraries. The program monitor inserts additional code for maintaining, propagating, and checking taint status before executing the code. In this way, we achieve comprehensive information flow tracing. At critical program points specified by our policy (e.g. indirect branch), run-time condition checking is performed to restrict sensitive data usage.
Shadow memory
As mentioned above, Tainttrace uses shadow memory to keep track of which memory is tainted and which in not. It uses following offset to store the shadow bytes representing the original program bytes:
l2 = l1[(addr >> 16) & 0xffff];
shadow = &l2[addr & 0xffff];
It uses a simple addressing strategy that maps the shadow memory byte by adding a constant offset, shadow base, to the application memory byte address. The customized loader partitions the memory space to support this mapping. This byte- to-byte mapping makes taint propagation simple and efficient.
0 – Good byte
1 – Bad byte
Implementation details
The loader is implemented by modifying the source code of Valgrind. It consists of two stages. In stage 1, it loads the code of stage 2 into the monitor space (0xb0000000 to 0xbfffffff) and transfers control to stage 2. In stage 2, the application and its shared libraries are loaded into the application space (0x000000000 to 0x57f00000). It also loads DynamoRIO into the monitor space and transfers control to DynamoRIO. DynamoRIO loads our program monitor, dr-instrument.so, implemented as a shared library, into the monitor space. DynamoRIO constructs basic blocks for execution and instrument. so is used to perform the instrumentation and intercept system calls. Syscall interception is used for several purposes: allocating shadow memory, marking taint status for data read from files or sockets, and modifying temporary file operations.
Limitations of TaintTrace
The main problem with TaintTrace is its performance overhead of 5 times, which is caused by the need for instrumentation and continuous memory monitoring. Additionally, it should be noted that it requires twice the amount of memory compared to the default due to the use of shadow memory.
Since its release in 2006, the developer has not actively maintained it for several years, making it largely deprecated and not widely used.
Resources:
ASAN (AddressSanatizer)
Address Sanatizer (ASAN) was first introduced by Google in 2012. Unlike first and second gen mitigations, this was introduced to detect memory corruption bugs in the debug environment and never meant to be part of the production system due to its performance implications.
In summary, AddressSanitizer (aka ASan) is a memory error detector tool that is implemented in different compiler like gcc, clang that detects bugs in the form of undefined or suspicious behavior by a compiler inserting instrumentation code at runtime. Asan is capable of detecting following class of memory corruption bugs:
- Use after free (dangling pointer dereference)
- Heap buffer overflow
- Stack buffer overflow
- Global buffer overflow
- Use after return
- Use after scope
- Initialization order bugs
- Memory leaks
Address Sanitizer Implementation details:
AddressSanitizer consists of two parts: an instrumentation module and a run-time library. The instrumentation module modifies the code to check the shadow state for each memory access and creates poisoned red-zones around stack and global objects to detect overflows and underflows. The run-time library replaces malloc, free and related functions, creates poisoned redzones around allocated heap regions, delays the reuse of freed heap regions, and does error reporting.
Let's try to run our classic buffer overflow program and observe the output produced by ASAN.
You can compile it using gcc and clang since both support ASAN, while compiling provide a special flag to tell the compiler to build binary with ASAN support.
Let’s execute the above program with a buffer overflow scenario:
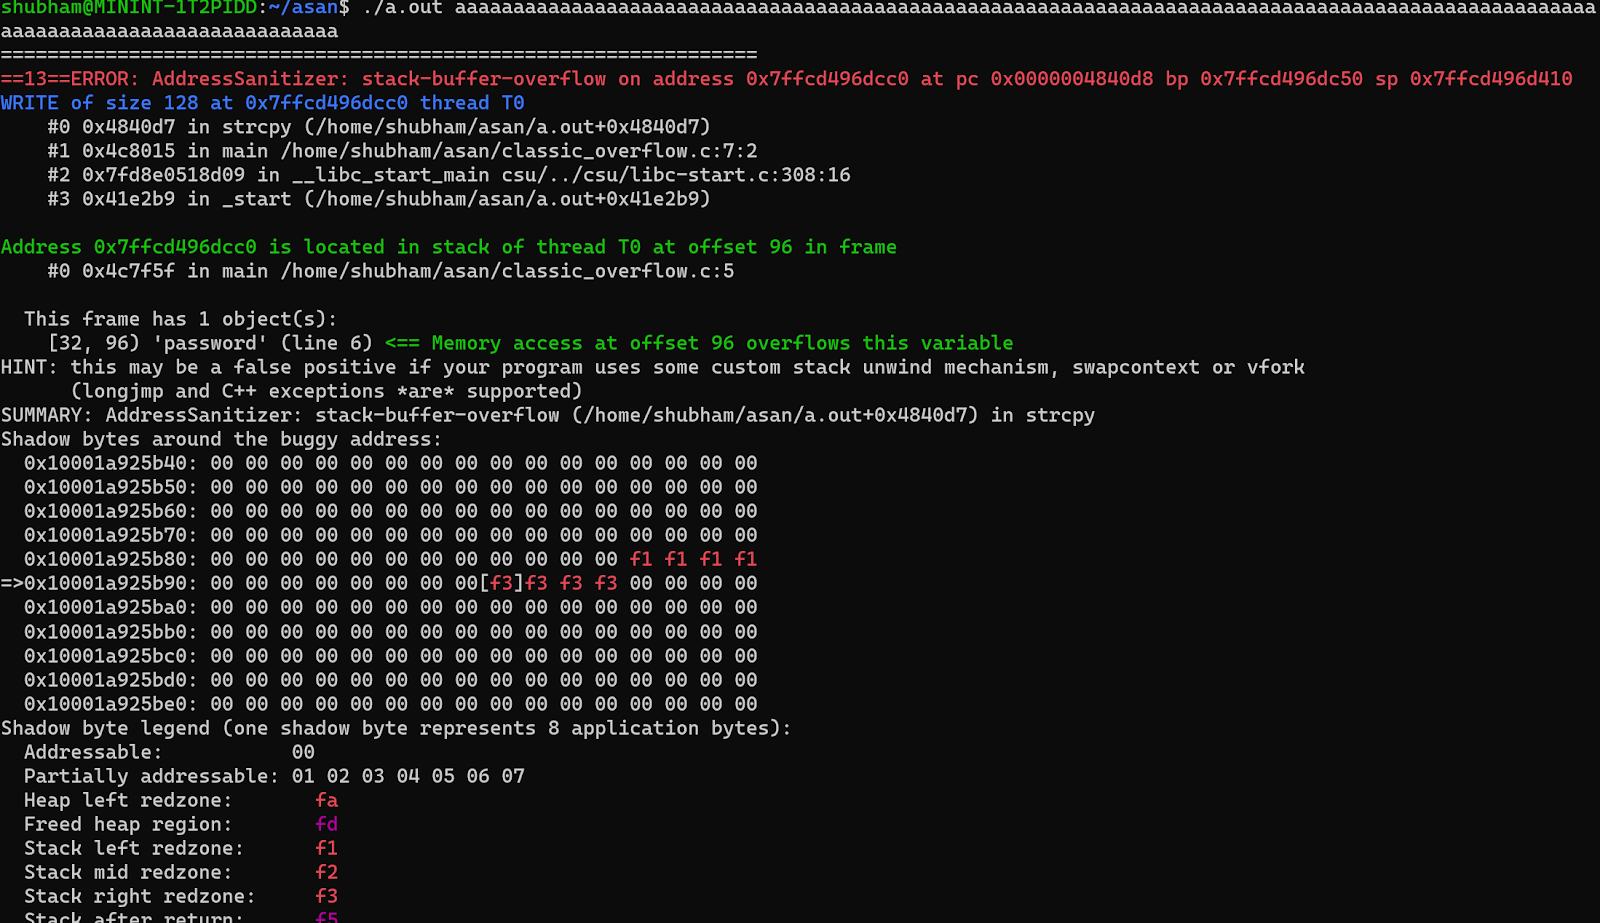
In the above scenario, it is evident that ASAN is capable of detecting the buffer overflow. Subsequently, the output provides the call stack. Adjacent to the call stack is the line number and the event that triggers the overflow. Following that, we possess the shadow memory that ASAN has preserved for the process. Let us delve deeper into the significance of this shadow memory.
Shadow memory
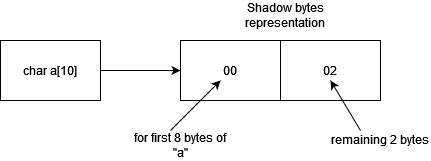
ASAN maintains a separate memory for itself in the process memory that keeps track of the original process memory (i.e stack and heap allocations). This shadow memory has information about the current state of the original memory. ASAN allocates 1 byte of shadow memory to each 8 bytes of application/process memory. These bytes can have one of the values:
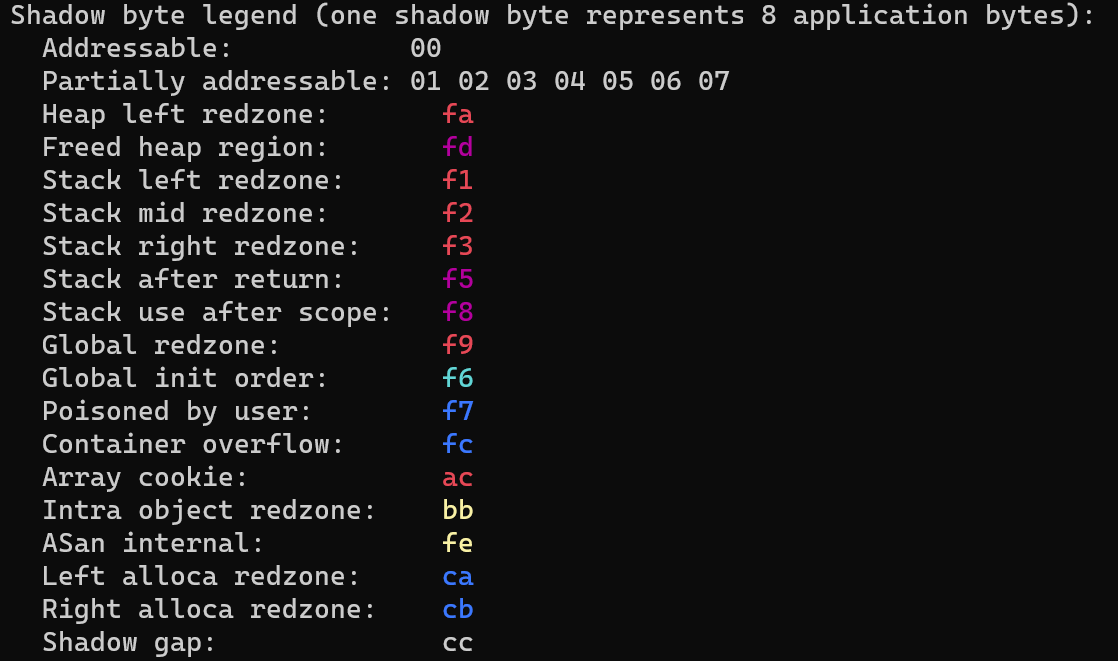
- FX (F1 to FF) – To refer the red zones. Red zones can also be referred as guard bytes that are memory that is not addressable to application flow i.e process events should not read/write these bytes (similar to guard pages).
- 00 – Complete 8 bytes that this shadow byte point is addressable.
- 0X (X lies between 0-7) – X number of bytes are addressable.
Let’s try to understand it with an example.
An allocation of 10 bytes using char a[10] will be represented as 00 02. Where 00 represents the first 8 bytes of allocated memory for “a” and 02 for the remaining 2 bytes.
Few more examples below:
Each of these shadow bytes are presented at fix offset to the original byte location: The ASAN runtime calculates the shadow byte address using following formula -> (address >> 3) + some_offset. This offset value is defined or set by the compiler during compilation.
Instrumentation:
Address sanitizer uses instrumentation to add the red zones around the boundary of each allocation and verify the shadow bytes on every access. When instrumenting an 8-byte memory access, Address Sanitizer computes the address of the corresponding shadow byte, loads that byte, and checks whether it is zero:
Runtime Library
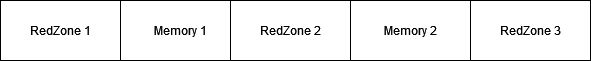
The main purpose of the run-time library is to manage the shadow memory. At application startup the entire shadow region is mapped so that no other part of the program can use it. For memory corruption detection against heap, malloc and free functions are replaced with a specialized implementation. The malloc function allocates extra memory, the redzone, around the returned region. The redzones are marked as unaddressable, or poisoned. The memory regions inside the allocator are organized as an array of freelists corresponding to a range of object sizes. When a freelist that corresponds to a requested object size is empty, a large group of memory regions with their redzones is allocated from the operating system. Each redzones is of minimum 32 bytes in size and looks something like this in memory
The free function poisons the entire memory region and puts it into quarantine, such that this region will not be allocated by malloc any time soon.
For globals, the redzones are created at compile time and the addresses of the redzones are passed to the run- time library at application startup.
For stack objects, the redzones are created and poisoned at run-time. Currently, redzones of 32 bytes (plus up to 31 bytes for alignment) are used.
ASAN in action
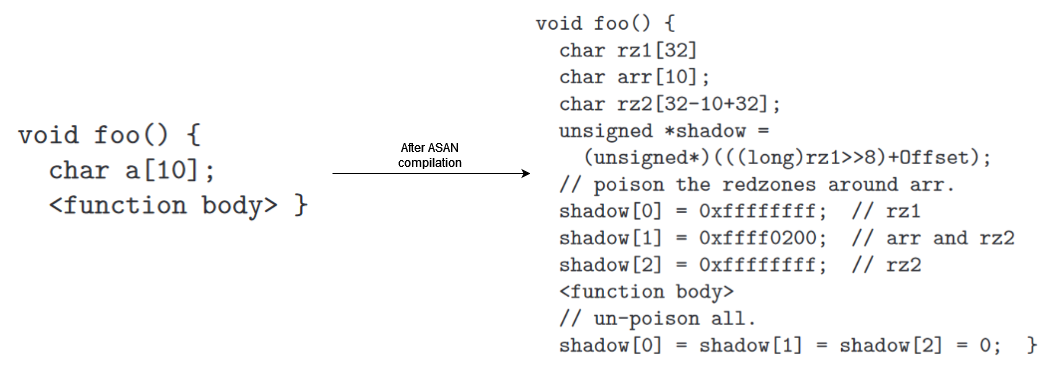
Let’s try to understand the instrumentation done by ASAN using a simple C program:
Before ASAN:
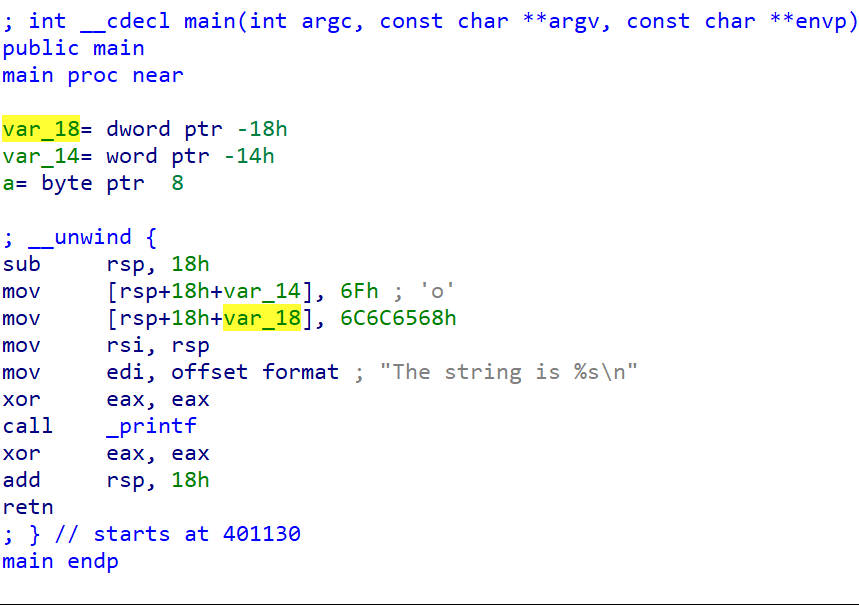
After ASAN:
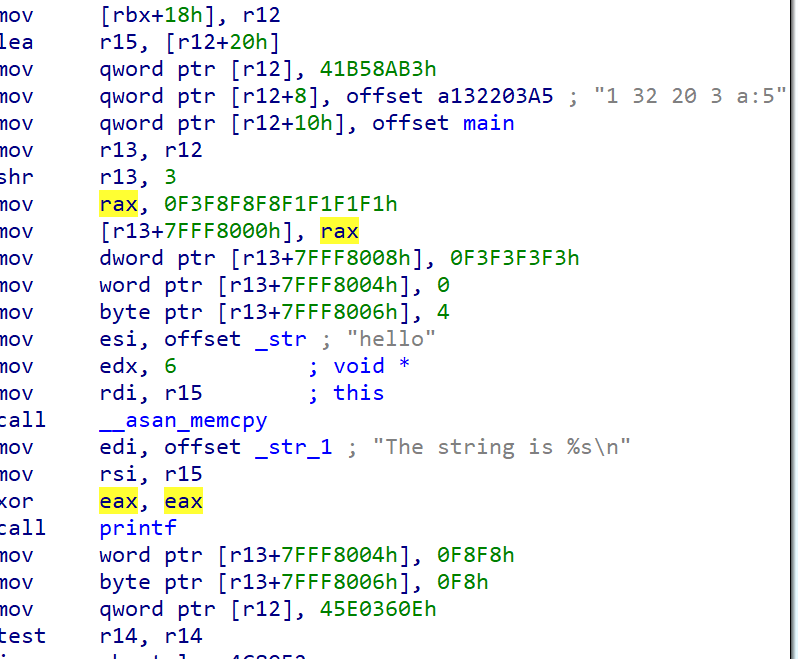
Below instructions are to create a fake stack frame for ASAN
Below instructions is to reach to the address of shadow memory using ( address >> 3). This offset can be changed based on ASAN flags.
If you look at the snippet below, the F1 bytes moved to r13+7FFF8000 is the stack left redzone and bytes at r13+7FFF8008 is the right redzone. From r13+7fff8004 to 7fff8008 is the representation of our buffer a[20] which is represented as 00 00 04 (equivalent to 20 bytes).
Full list of redzone bytes identification below:
You will also observe that the memcpy has been substituted with asan_memcpy, which is a component of the ASAN runtime library employed to ascertain if we are copying the data to the accurate location and no redzone bytes are being written. A very comparable ASAN concept operates for Heap.
Currently ASAN is supported in following compilers:
- Clang (starting from version 3.1)
- GCC (starting from version 4.8)
- Xcode (starting from version 7.0)
- MSVC (widely available starting from version 16.9).
Limitation of ASAN
- On an average, the ASAN instrumentation enhances the processing time by approximately 73% and the memory usage by 240%. Due to this reason, it is never utilized in production but instead confined to usage in a debugging environment or utilized by fuzzers such as libfuzzer and AFL to identify memory corruptions.
- TheASAN instrumentation may miss a very rare type of bug: an unaligned access that is partially out-of-bounds. For example:
if an out-of-bounds access touches memory too far away from the object bound it may land in a different valid allocation and the bug will be missed.
Resources:
https://storage.googleapis.com/pub-tools-public-publication-data/pdf/37752.pdf
UBSAN (UndefinedBehaviorSanitizer)
UBSAN was introduced in 2012 in clang project starting from version 3.3 and 2013 in GCC since version 4.9. UBSAN uses compile-time instrumentation to catch undefined behavior during program execution.
These are some common types of bugs that UBSAN detect:
- Array subscript out of bounds, where the bounds can be statically determined
- Bitwise shifts that are out of bounds for their data type
- Dereferencing misaligned or null pointers
- Signed integer overflow
- Conversion to, from, or between floating-point types which would overflow the destination
It works in similar fashion like any other sanitizers, by instrumenting every memory load.
UBSAN in action
Let’s look at the case of null pointer dereference in C program:
Compile it using clang and execute it:
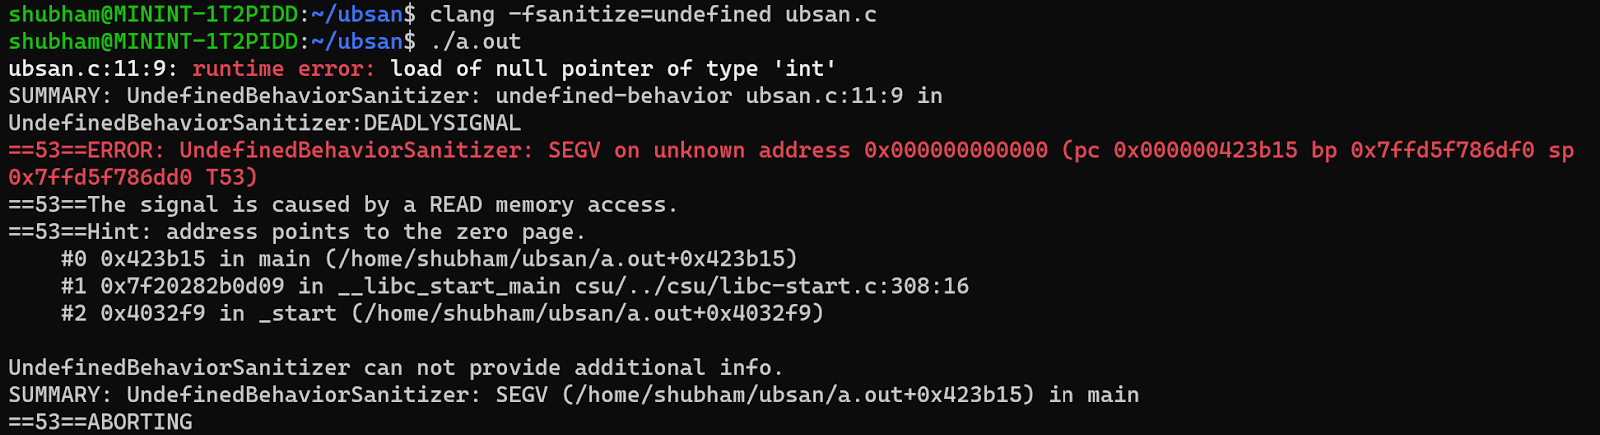
You can see UBSAN has detected null pointer dereference occur due to c=*pi. Let’s see how the compiled binary code changes.
Before
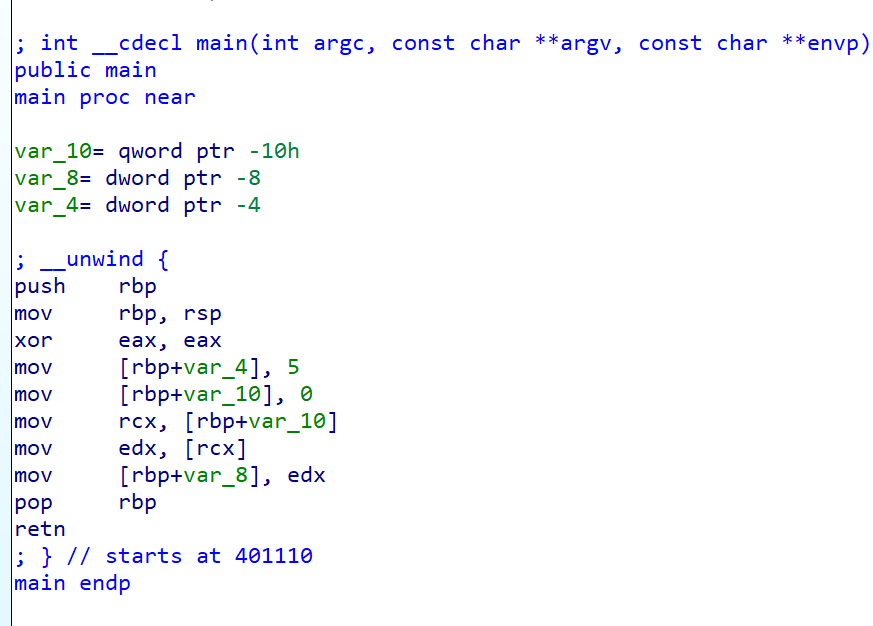
After
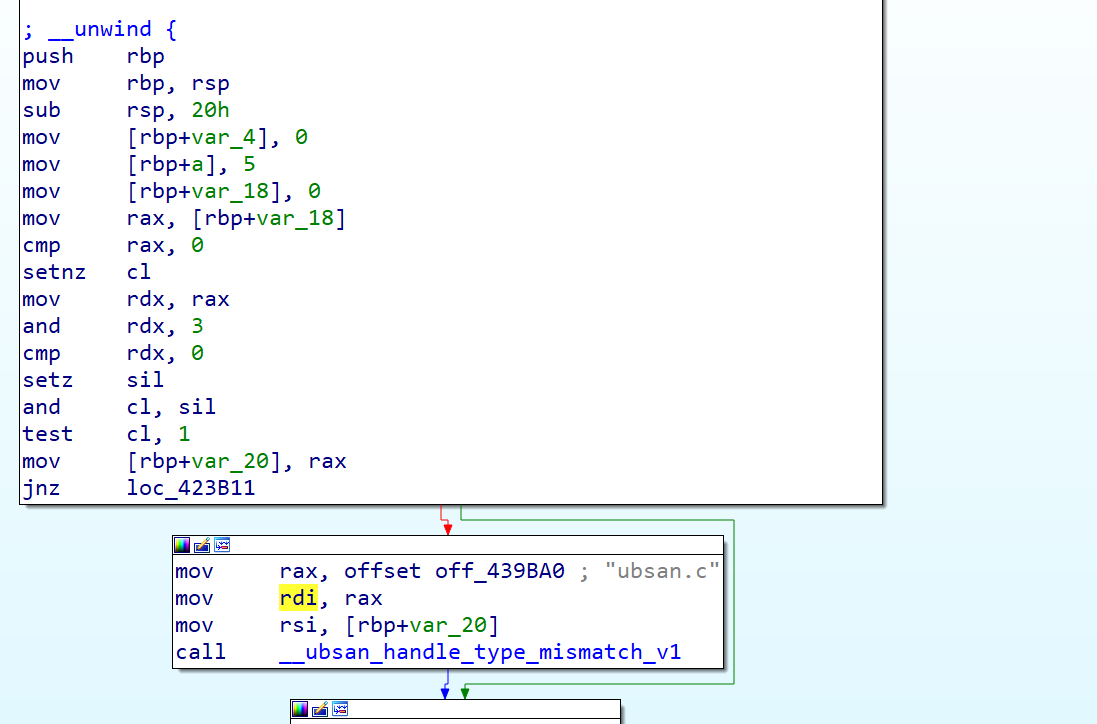
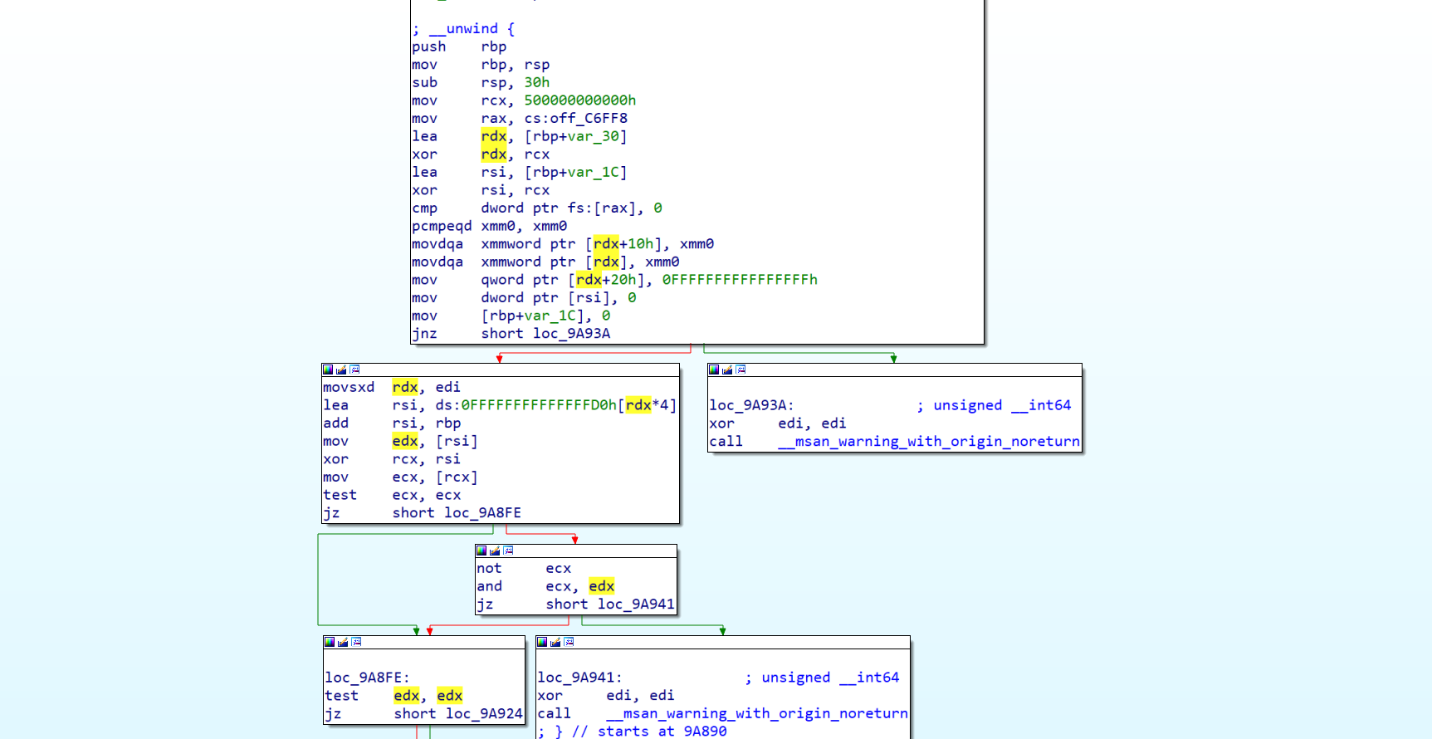
You will notice in UBSAN compiled code adds null pointer check after each memory load into register using cmp instruction. At the end it has __ubsan_handle_type_mismatch which detects any NULL pointer access, unaligned memory access, or accessing memory from a pointer whose data is an insufficient size.
Limitations of UBSAN
Similar to ASAN, UBsan has performance related drawback. Adding UBSan instrumentation slows down programs by around 2 to 3x and increases the file size by around 20 times.
Resources:
https://clang.llvm.org/docs/UndefinedBehaviorSanitizer.html
MSAN (Memory Sanitizer)
The MSAN was initially presented in 2015 by the same group that was accountable for creating the ASAN. The primary objective of the MSAN was to identify uninitialized memory in the C/C++. In a manner similar to the ASAN, it operates through compile time instrumentation, but at present, it is only compatible with CLANG.
MSAN implementation details
MSAN uses shadow memory, instrumentation and runtime library similar to ASAN but doesn’t require red zones to work. Detailed working explained below.
Shadow memory
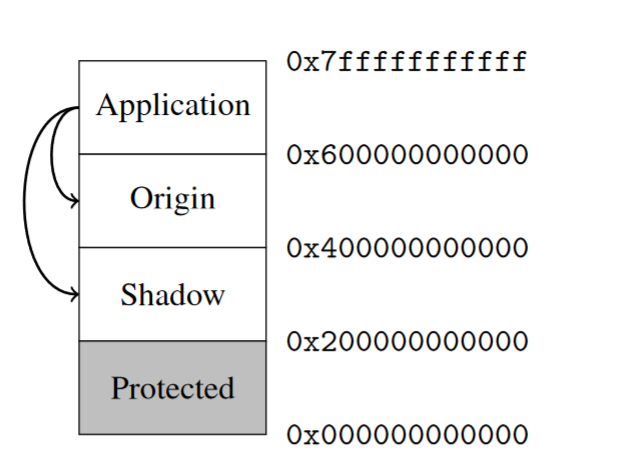
MemorySanitizer employs 1-to-1 shadow mapping, i.e. for each bit of application memory the tool keeps one bit of shadow memory. Bit 0 in shadow memory stands for initialized, or defined bit, and value 1 — for uninitialized (undefined) bit. All newly allocated memory is “poisoned”, i.e. corresponding shadow memory is filled with 0xFF, signifying that all bits of this memory are uninitialized.
For origin tracking it allocates another region of the same size immediately following the shadow memory region.
Instrumentation
MemorySanitizer needs to handle all possible LLVM IR (SSA-based program representation) instructions either by checking operand shadow, or by propagating it to the result shadow. For every IR temporary value MemorySanitizer creates another temporary that holds its shadow value.
Runtime library
MemorySanitizer runtime library shares much common code with AddressSanitizer and ThreadSanitizer libraries. At startup it makes the lower protected area inaccessible, and maps Shadow and, optionally, Origin areas. MemorySanitizer uses the same allocator as the other Sanitizer tools. It does not add redzones around memory allocations, and does not implement memory quarantine. Allocated regions (with the exception of calloc regions) are marked as uninitialized, or ‘poisoned‘. Deallocated regions are marked uninitialized as well.
MemorySanitizer also implements origin tracking, which helps users to understand the errors. In origin tracking mode, MemorySanitizer associates a 32-bit origin value with each application value. This value serves as an identifier of a memory allocation (either heap or stack) that created the uninitialized bits this value depends on.
MSAN in action
Let’s look at MSAN in action with a small illustration.
Compile the above program with MSAN and execute it. You will find following report from MSAN
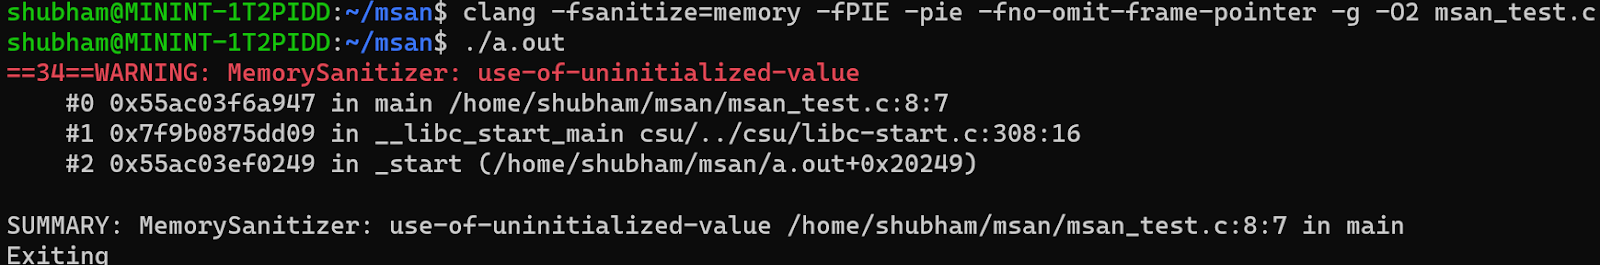
You will observe that MSAN has identified the utilization of an uninitialized value in the line that contains if(a[argc]). MemorySanitizer is capable of retracing each uninitialized value back to the memory allocation where it originated from, and utilize this data in the generated reports. This functionality is activated by using the -fsanitize-memory-track-origins flag.
Let’s see how the program differ in IDA:
Before:
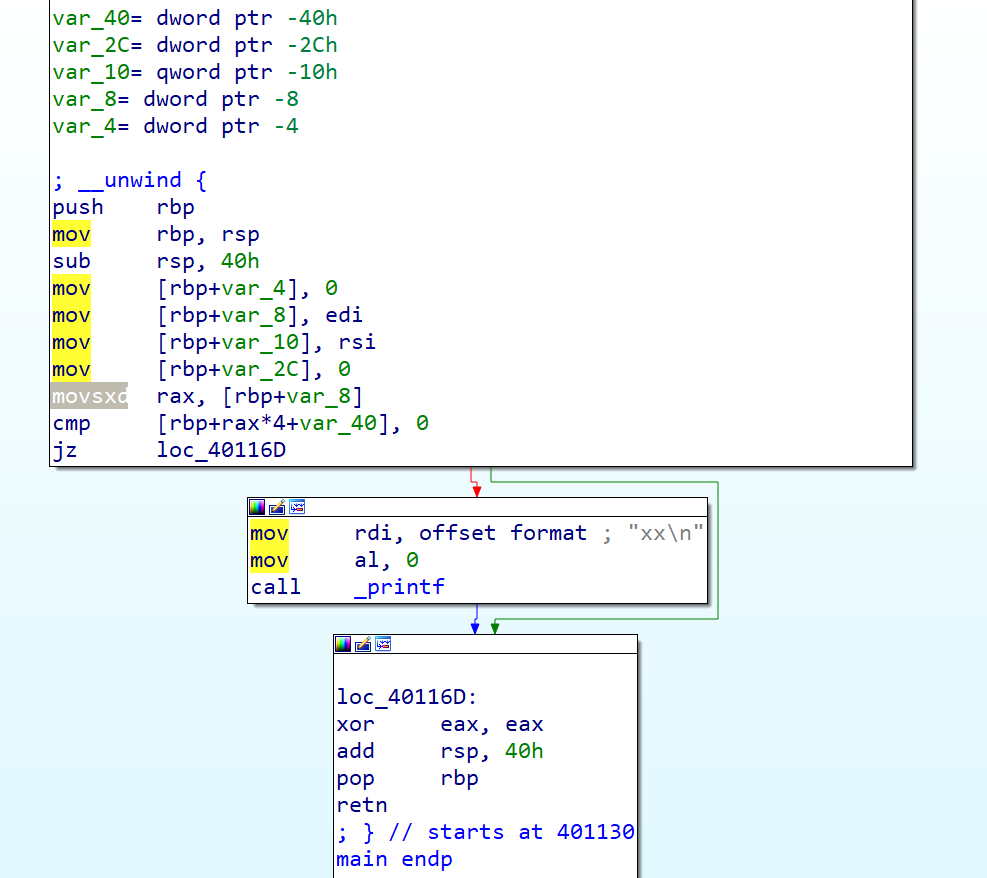
After
Limitations of MSAN
MSAN does it’s job pretty well without any False negatives or false positives, only drawback it holds similar to other such tool is it’s performance overhead which limit it to use only in testing environment. It takes 2x more memory as it needs 1:1 shadow memory mapping and the execution time get increased to 2.5x due to instrumentation and runtime library work.
Other drawback of MSAN is its limited support to clang and linux environments.
Resources:
https://static.googleusercontent.com/media/research.google.com/en//pubs/archive/43308.pdf
MTE (Memory tagging Extension)
In 2018, ARM unveiled MTE in ARMv8.5-A, a hardware-enforced memory violation feature for the ARM architecture. It is referred to as a replacement for sanitizers due to its close resemblance in functionality, but with significantly reduced overhead. Unlike all the other tools mentioned in this chapter, MTE is currently the only tool being utilized in production(reference).
MTE internals
MTE is based on the concept of tagging. To store tags in virtual addresses, It uses the “Top byte ignore” bits in 64 bit AARCH64 addressing.
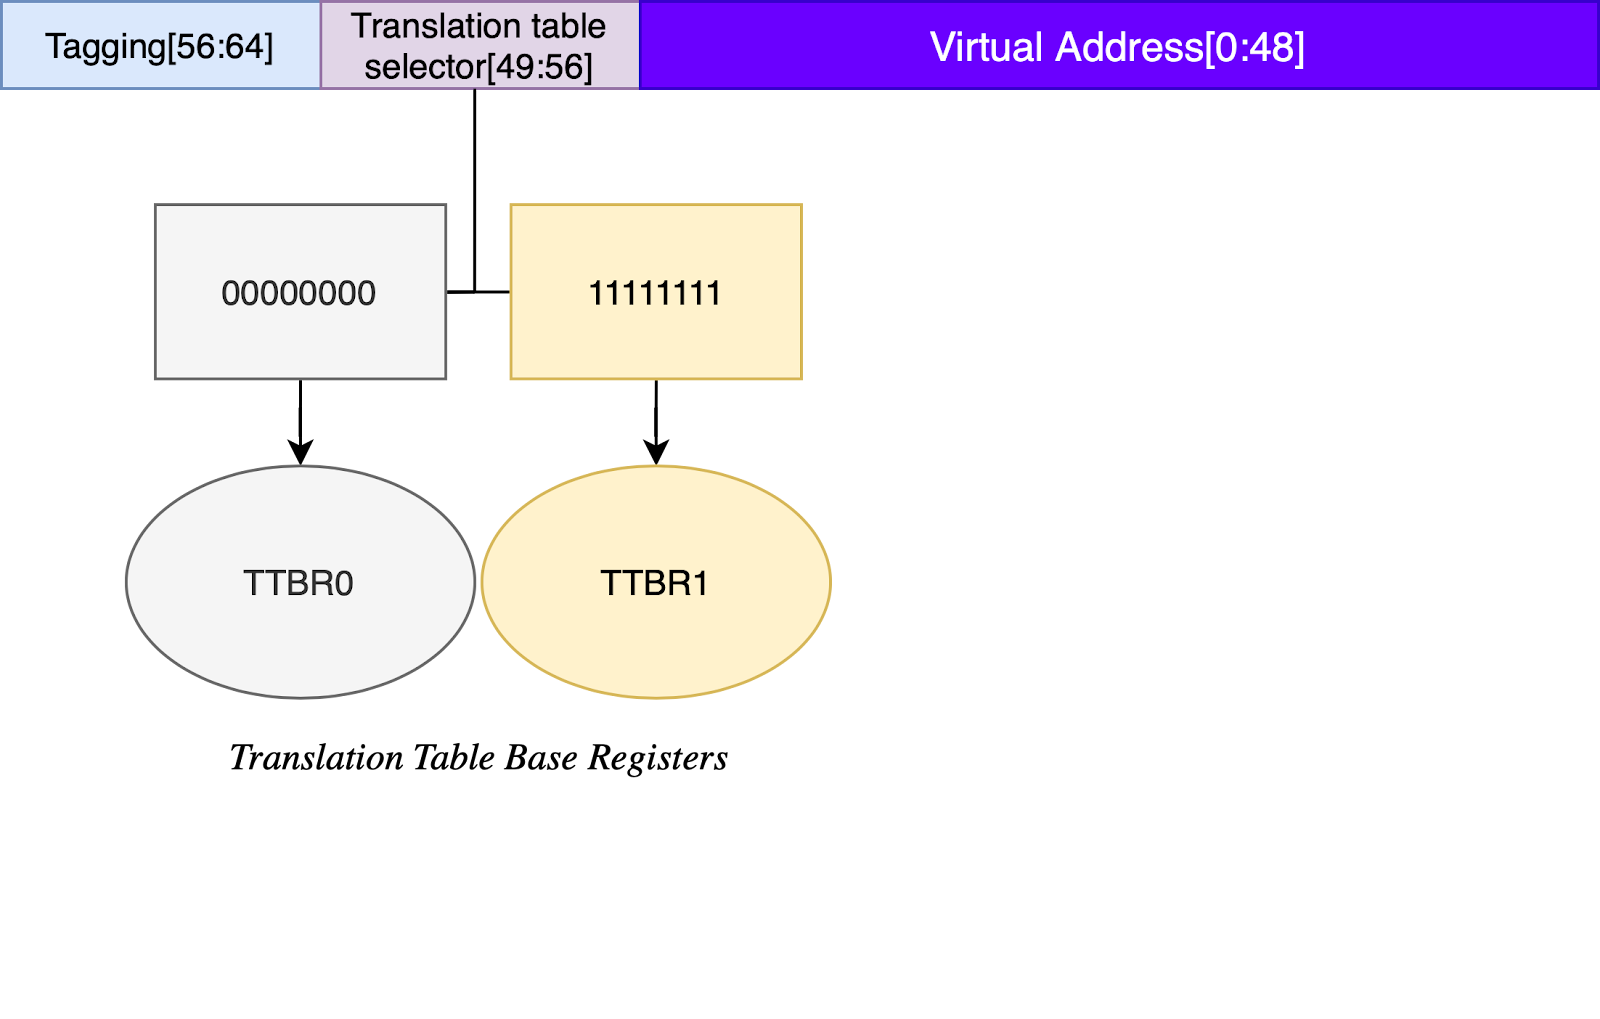
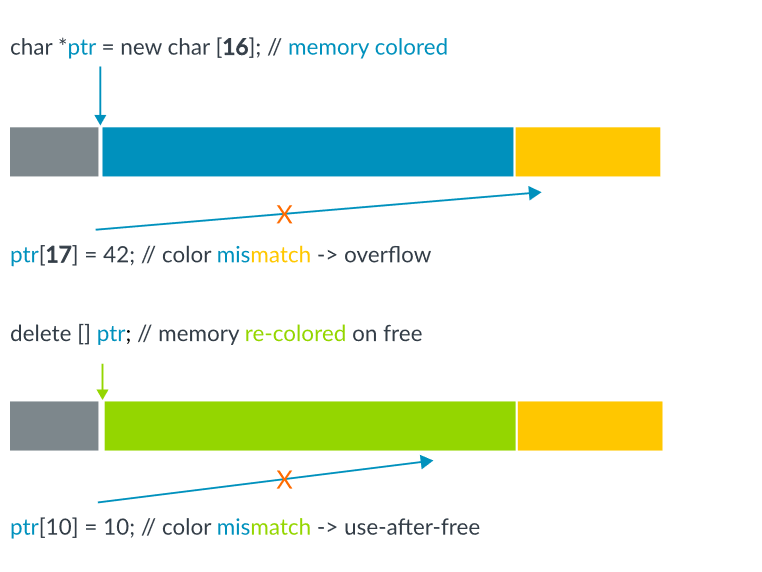
At high level, when MTE is turned on, memory locations are tagged by adding four bits of metadata to each 16 bytes of physical memory. On memory store/allocation, the same tag is moved into the virtual address. During dereference/loading, tag are matched if they are same or not. The whole concept can be understood better using the illustration below.
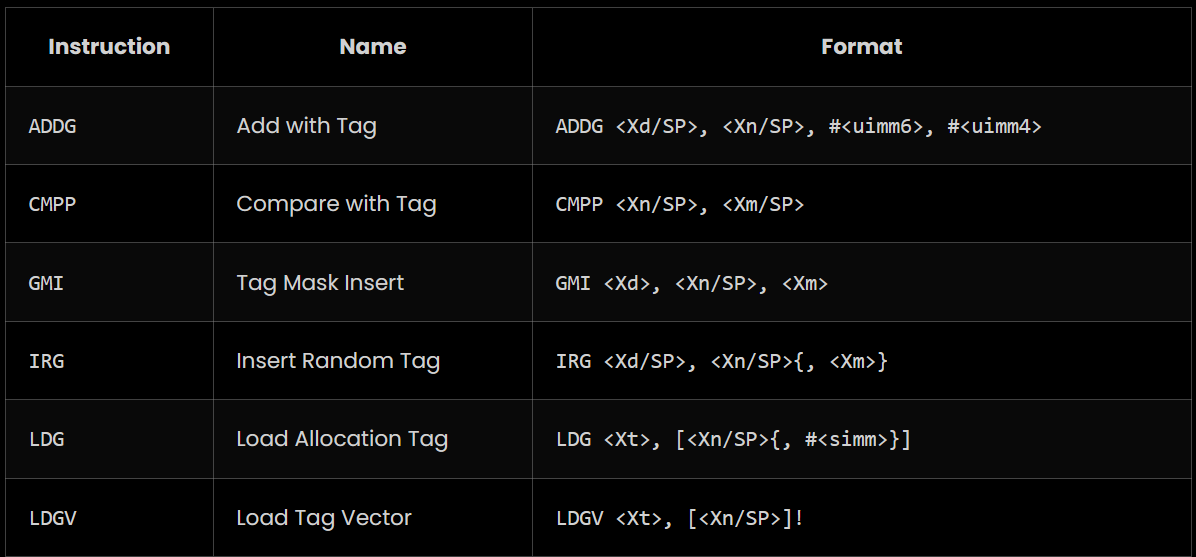
To use MTE in linux(currently only supported by llvm), compile and link your program with -fsanitize=memtag flag. This will only work when targeting AArch64 with MemTag extension. One possible way to achieve that is to add -target aarch64-linux -march=armv8+memtag to compilation flags. Below are the common instruction compiler can use to add tags to program.
Resources:
https://8ksec.io/arm64-reversing-and-exploitation-part-10-intro-to-arm-memory-tagging-extension-mte/
Future of Memory corruptions and it’s mitigations
Examining the evolution of memory corruption vulnerabilities reveals a notable shift in recent years. The collective awareness within the security industry and among developers has significantly increased, leading to a decline in the prevalence of straightforward memory corruptions. However, these vulnerabilities persist in more intricate forms. Notably, the realms of Linux and Windows kernelspace continue to harbor traditional memory corruption vulnerabilities, albeit in decreasing numbers.
Despite the persistence of these vulnerabilities, the implementation of robust mitigations has made exploiting memory corruptions progressively challenging. As security measures become more sophisticated, the traditional avenues for attacks are closing, pushing adversaries towards exploiting complex and less common scenarios.
In the landscape of mitigations, we currently deploy first-generation defenses that provide protection against a wide range of cases. Second-generation mitigation support is now integrated into most compilers and architectures, although it is not always enabled by default. There remains room for improvement in terms of performance, and efforts are underway to strike the right balance between security and efficiency.
Additionally, the collaboration between hardware and software ecosystems is strengthening, with more emphasis on designing processors and architectures that inherently resist memory corruption exploits. The integration of hardware-enforced security mechanisms, such as Intel's Control-Flow Enforcement Technology (CET) and ARM's Pointer Authentication Codes (PAC), adds an extra layer of defense against memory-based attacks.
Moreover, the adoption of DevSecOps practices is playing a pivotal role in mitigating memory corruption risks. The continuous integration and deployment pipelines incorporate security checks (chapter 3) and automated testing for identifying and addressing vulnerabilities in the early stages of development.
In conclusion, while memory corruption vulnerabilities persist, the landscape is evolving towards a more resilient future. The combination of advanced mitigations, collaborative hardware-software efforts, and proactive development practices positions the cybersecurity community to stay one step ahead in the ongoing cat-and-mouse game with malicious actors.
Memory-safe Programming Languages:
Using memory-safe programming languages, such as Rust or Ada, can provide inherent memory protection by preventing common programming errors like buffer overflows, use-after-free, and null pointer dereferences. These languages incorporate memory safety features into their design and mitigate many memory-related vulnerabilities. Major platform vendors like Microsoft and linux kernel are spending their resources and money to shift the core of their operating system from C/C++ to more robust language rust. It will be interesting to see the outcome in upcoming years.
Mitigation matrix:
The matrix provided below will prove beneficial for both security researchers and developers. Security professionals can utilize it to identify the current mitigations available and the potential challenges they may encounter in real-world applications. Developers can also make use of this matrix to determine the necessary measures to incorporate into their applications while ensuring minimal impact on performance.
Yellow: First generation mitigation
Blue: Second generation mitigation
Blue: Error detection tools