In this part of article we will look at more questions on Dynamic analysis. After that we will cover Debugging and Static analysis.
Click here for Part 1
Click here for Part 2
Dynamic Analysis(Cont.)
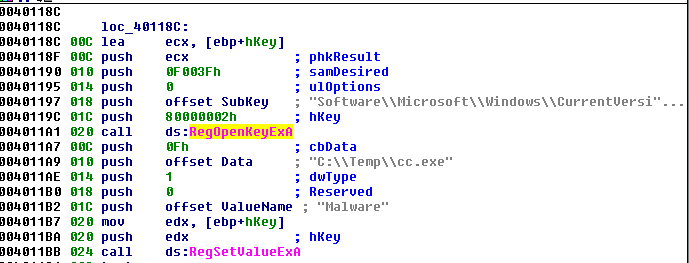
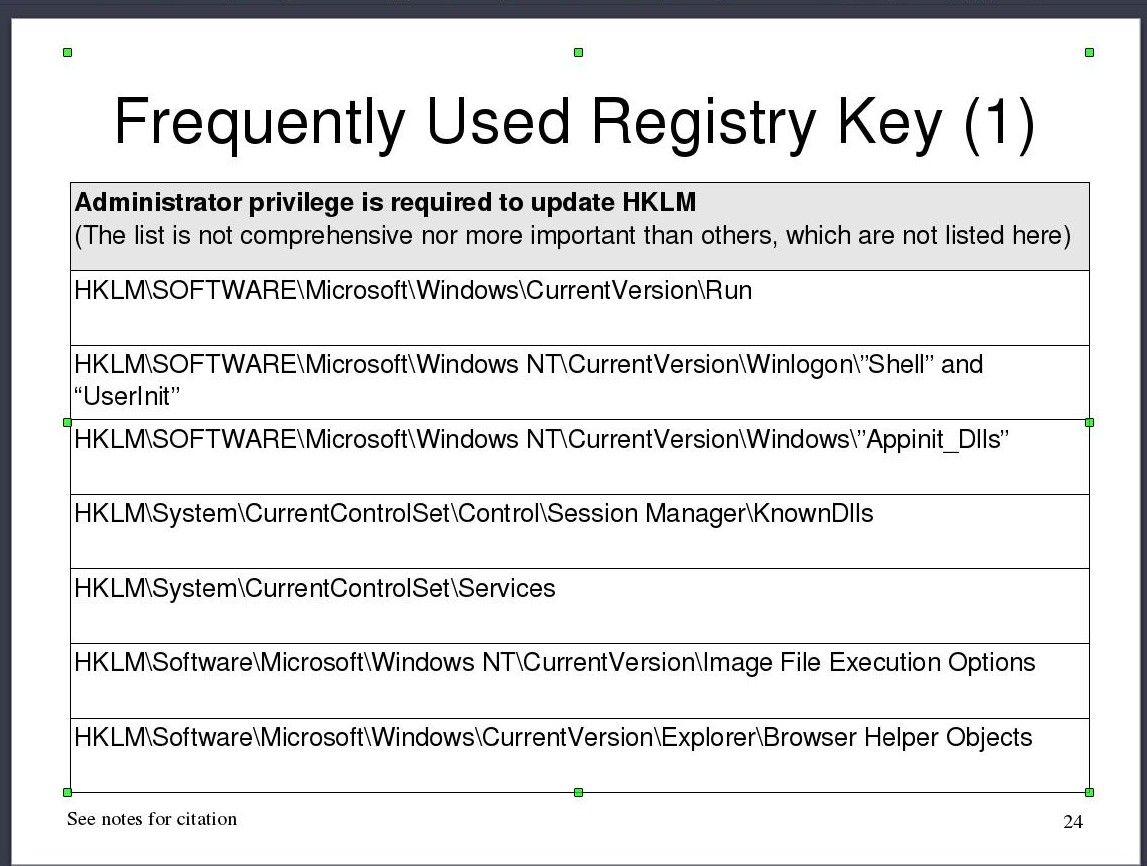
3) What are the most common registry location malware add them self for persistence?
Answer:
Most common registry key which you need to remember is:
HKLM\SOFTWARE\Microsoft\Windows\CurrentVersion\Run
or
HKCU\SOFTWARE\Microsoft\Windows\CurrentVersion\Run //Only for current user
Other locations that you don't need to remember but are important for future reference:
Most of the time analyst use Autoruns tool from Sysinternals for looking at all such registry locations/keys.
4) What API calls pattern malware show for DLL injection?
Answer:
It is one of the most asked question in dynamic analysis.
h=OpenProcess(,,proc_id)
addr = VirtualAllocEx(h,,size,,,)
WriteProcessMem(h,addr,buf,size,...)
CreateRemoteThread(h,,,start,param,...)
5) What other process injection/hooking methods are available?
Answer:
- Code injection
- Dll injection
- Dll search order hijacking
- APC injection
- IAT/EAT Hooking
- Inline hooking
Interviewer may ask further questions on any of these techniques, so you must be prepared for that. You can read further about process injection in given links:
API Hooking and DLL Injection on Windows
API hooking revealed
Ten Process Injection Techniques: A Technical Survey of Common and Trending Process Injection Techniques
6) What is process hollowing?
Answer:
Process hollowing is a technique used by malware in which a legitimate process is loaded on the system solely to act as a container for hostile code.
I would recommend you to watch first 20:00 minutes of this Blackhat talk to understand it completely.
Static analysis and Debugging
Debugging and static analysis are core part of malware analysis. Most questions in this topic are related to how you use IDA or ollydbg or any of your favorite debugger.
1) Do you use IDA or ollydbg? Which one of them is your favorite and Why?
Variant: What do you like in ollydbg(or IDA) that is not present in IDA(or ollydbg)?
The answer depends on your personal choice and experience, but I am putting my view on them.
Answer:
I use IDA Pro for mostly static analysis purpose and Ollydbg for debugging purposes.IDA has graph view which make static analysis very easy and ollydbg has large plugin support that makes debugging easy.
Other than that I have spent large reversing time on ollydbg, hence my hands are more settle on olly rather than IDA.
2) How many types of breakpoints are available in debugger?
Answer:
This is a frequently asked question. There are four types of breakpoints available:
- Software breakpoint (use
int 3instruction) - Hardware breakpoint (use debug registers DR0-3)
- Memory breakpoint (use guard pages)
- Conditional Breakpoint (Debugger specific)
3) How many hardware breakpoint are available in debuggers?
Answer:
There are 4 hardware breakpoints available in debugger. The reason why there are only 4 of them is because hardware breakpoint use debug register to store the memory address where breakpoint is set. There are only 8 debug register in Intel x86 -> DR0-DR7 from which only four are used for breakpoint.
DR0-3 = breakpoint registers
DR4-5 = reserved (unused)
DR6 = Debug Status Register
DR7 = Debug Control Register
4) How software breakpoint work?
Answer:
INT 3 instruction is what debuggers are using when they are setting a “software breakpoint”.
In depth:
When a debugger uses a software breakpoint, what it does is overwrite the first byte of the instruction at the specified address with CC byte (`int 3` opcode). It keeps its own list of which bytes it overwrote and where.
int Instruction is used to cause interrupt. Value 3 in int 3 tells the kernel go to vector 3 in interrupt table. While running the program when int 3 executed, exception(fault) occur which transfer the control to interrupt handler for interrupt vector 3. The interrupt handler transfer the control to registered debugger, which is usually the debugger you are using for setting the breakpoint. Then your debugger handle the breakpoint and remove the CC byte for further execution of instructions.
4)In what condition you need to use hardware breakpoint instead of software?
Variant: Why we use hardware breakpoints on dll's instead of software breakpoint?
Answer:
Software breakpoint have limitation to be only set breakpoint on code section of the program since it put int 3 instruction. For other memory locations you cannot use software breakpoint.
Other then that if you try to put software breakpoint on any loaded dll's code, then every time you reload the program the breakpoint get removed because the int3 instruction get replace with the original instruction again.
You can read more about H/W and S/W breakpoint here.
5) What are different anti-debugging/anti-analysis methods available are used by malwares?
Answer:
There are lots of anti-analysis methods present. I am mentioning the important ones that are used most.
- PEB!IsDebugged flag is checked if contain 0 or 1. The instructions look like below:
mov eax, fs:[30]
mov eax, [eax+2]
test eax, eax
jnz exit_debugger_detected
-
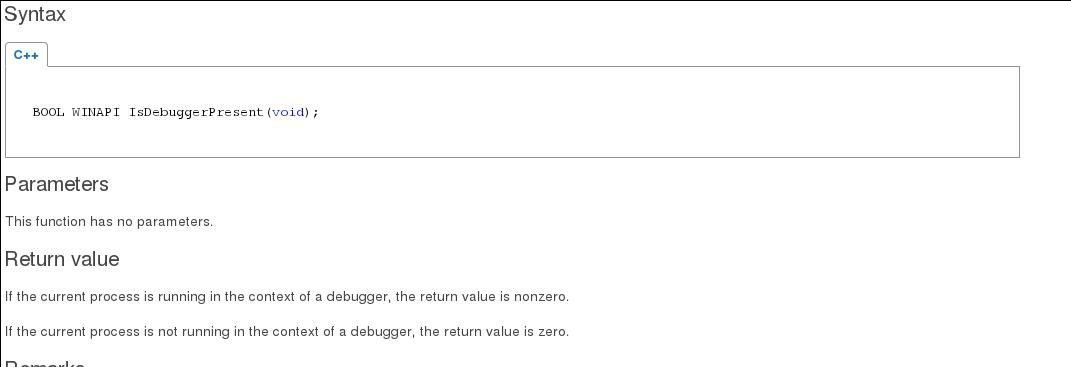
kernel32!IsDebuggerPresent function is used.
-
GetTickCountorQueryPerformanceCountercalls are used for time based checking. -
RDTSCinstructions (Read Time Stamp Counter). They generally come in pairs, followed by a comparison.
rdtsc
mov ebx, eax
  ... some measured code ...
rdtsc
sub eax, ebx
cmp eax, ... some tick count ...
jg detected_debugger
You can read many other anti-analysis here.
6) What packer does?
Answer:
There are lots of packers tool present that works little different from each other. But most commonly code and data is compressed/encrypted/encoded at a block level by packers. Then they add new section(eg .packed) where they put unpacking stub. They also modify header like changing Entry point to unpacking stub and few other fields.
7) How to unpack packed code?
Answer:
Interviewers may ask you if you have previous experience in unpacking packed executable. A general way to deal with this is as follow:
Often packer's stub start with pusha(push all general purpose register) and ends with popa(pop all registers) follow by a jump. The jump is at far location(mostly to other section of pe).
After the jump you land to OEP. You can dump the unpacked code to new pe file using ollydump plugin.
So here ends all the questions for debugging and static analysis. In the part 4 of the series we will look at some advance and miscellaneous questions.